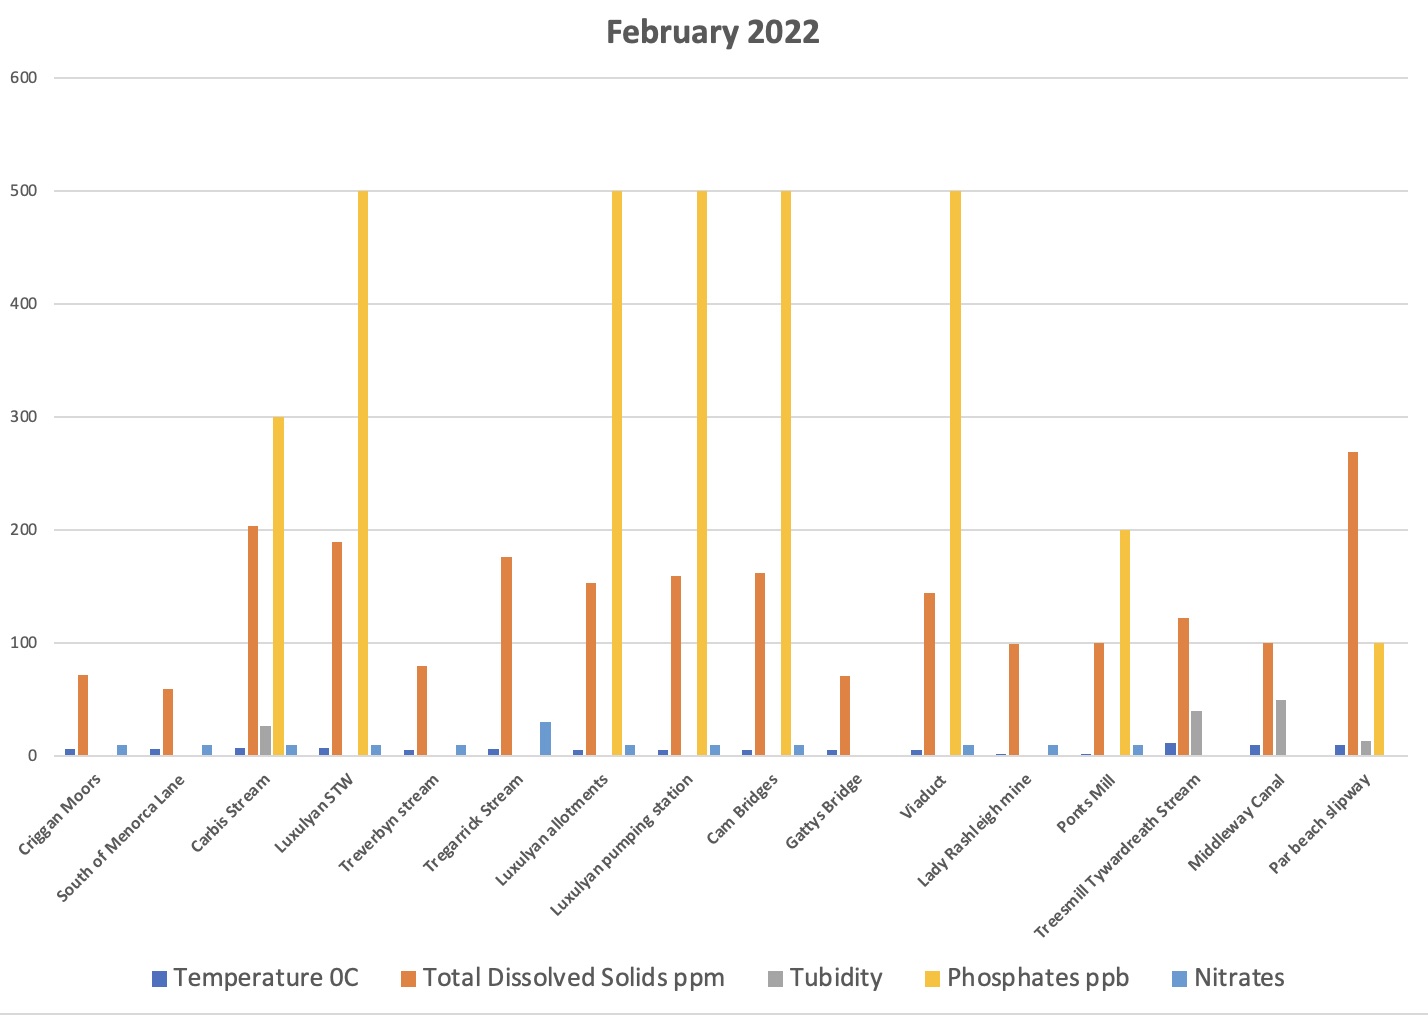
February 2022 - results on an outgoing tide
This month we included an additional monitoring point on the Par River at Par Beach. This is tidal but is tested at low tide in order to monitor river, and not sea water. Thanks to Veronica Jones for testing there. The group now monitors from near the source to the estuary of the Par River.
For the first time nitrate testing was performed at some points on the Par River. More on that later.
Most sampling was conducted after 24 hours of dry, or relatively dry, weather but testing at Middleway, Treesmill and Par Beach occurred after heavy, prolonged rain, which makes comparison with other sites more difficult.
Phosphate levels between Luxulyan STW and the Treffry Viaduct continue to be ‘Too High’ (500 ppb) but not as high as have been noted in the past.
Recent otter spraint, containing fish bones and scales, as well as older spraint was found along the river from Luxulyan to Pontsmill, indicating the river is healthy enough to support some fish life.
On 21st February we had training from Lydia Deacon (WRT) on testing for the presence of E.coli and other coliforms.
Why are we monitoring nitrate levels?
Along with phosphates, excessive nitrate levels are another indication of river pollution. Excessive nitrate levels can lead to acidification and ‘eutrophication’ where the excessive available nitrogen encourages the overgrowth of vegetation and algae in the river, crowding out other species and reducing biodiversity. With climate change, more frequent storm events are likely to increase nitrate losses from land into water, while hotter summers will encourage plant growth.
The European safe level of nitrates in drinking water is set at 50 mg/l. Defra describes the problem nationally in terms of Nitrate Vulnerable Zones (NVZs) which is a good measure of the extent of nitrate pollution, particularly in lowland areas:
- 44% of land in England is NVZ because rivers breach the 50 mg/l test
- 25% of England is NVZ because groundwater breach the 50 mg/l test
- 6% of England is NVZ because of eutrophication is estuaries and lakes/reservoirs
The map below shows the mean nitrate levels from sampling points in rivers and lakes during 2014-15:
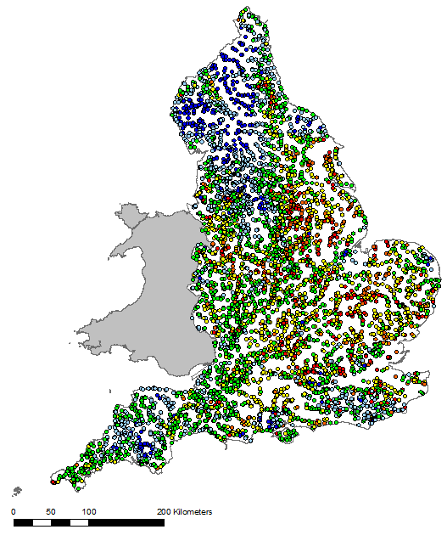
Since 2000 there have been widespread declines in measured nitrate concentrations in English rivers, remaining low until 2015. However, this changed with a notable rise between 2016 and 2018. The reason for this increase is not fully understood but it is likely to be due to the impact of dry weather, changes in cropping patterns and increased spreading of materials to land. Population increases also bring challenges in dealing with increased volumes of sewage effluent.
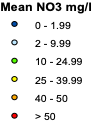
Where does nitrate pollution come from?
The map shows the various contributors to nitrate pollution by area, the majority of which is agriculture and sewage in the southwest, while agricultural practices and water companies are the most frequent reasons given for not achieving a good status.
As funding for the Environment Agency and water monitoring is not what it could be nitrate monitoring it is yet another way the Citizen Scientist Group and Westcountry Rivers Trust can help monitor river health and hopefully provide support for managing land and waterways in a more sustainable manner in a continually changing environment.
None of the nitrate samples in our stretch of the River Par tested above 10mg/l, well below safe drinking water standards, which is good news so far!
Source: Taken from Environment Agency, October 2021: Nitrates: Challenges for the water environment.
